Farmers must be at the top of their game to survive, let alone thrive, in the years ahead with a wider variation in farm performance expected than ever before.
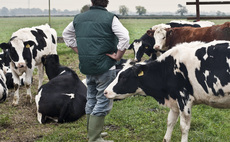
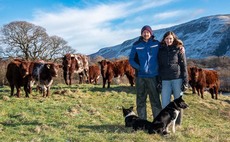
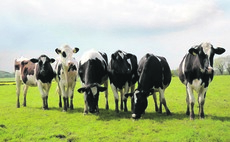
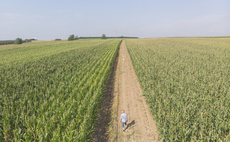
That was the message from John Nix Farm Management Pocketbook author Graham Redman, as he highlighted dairy and arable farmers may benefit from higher milk and grain prices whilst the grazing and intensive livestock sectors ‘on balance’ stand to lose out.
The 2023 edition of the book showed there would be winners and losers from the current economic circumstances.
“This is an opportunity for some and a big concern for other farmers,” Mr Redman said.
He said the range in budgeted margins was vast, dependent on farm structure, enterprises and performance.
“Planning for the year and thinking about capturing the opportunities whilst mitigating the risks is vital in these particularly uncertain times,” he said, advising carefully putting budgets together and working out what prices the farm system can operate at.
Lord Don Curry, who wrote the foreword for the John Nix pocketbook, pointed out the amount of change in the industry was currently without parallel highlighting the transformation in agricultural policy towards the provision of public goods, the impact of post-Brexit trade deals which may undercut domestic standards and the war in Ukraine impacting energy grain and fertiliser markets.
But Mr Curry also highlighted the recent Government food strategy placed increased importance on UK-produced food.
He added despite all the challenges the future was undeniably bright for many.
Mr Redman said there was a considerable range between farming types, but also a big difference between average and top performing farms.
“To survive, let alone thrive, managers must be at the top of their game in the years ahead,” he said.
“There are opportunities for famers, but many may find it hard to grow their profit in the coming year.”
Table
| 2023 Whole Farm Figures | Combinable Crops | Dairy | Lowland | Upland | ||||
| /Ha | Beef & Sheep | Beef & Sheep | ||||||
| Performance level | Average | High | Average | High | Average | High | Average | High |
| Farm Gross Margin | 1031 | 1277 | 2604 | 2987 | 337 | 690 | 212 | 412 |
| Total Fixed Costs | 725 | 653 | 1715 | 1544 | 950 | 855 | 525 | 473 |
| Margin Before Rent & Finance | 306 | 624 | 889 | 1443 | -613 | -165 | -313 | -61 |
| LessRent & Finance | 150 | 150 | 210 | 210 | 125 | 125 | 70 | 70 |
| PlusSupport & Diversification | 218 | 222 | 203 | 207 | 312 | 321 | 178 | 181 |
| Business Profit (Loss) | 374 | 696 | 882 | 1441 | -426 | 31 | -205 | 50 |